When we talk about univariate analysis, we will normally find elements such as:
- Histograms.
- Percentiles: The percentile (or centile) is the value of the variable below which a certain percentage of observations fall; for example, the 20th percentile is the value (or score) below which 20 per cent of the observations fall.
- Statistical moments: Mean, median, standard deviation.
- The moment above zero: Mean, median, second moment.
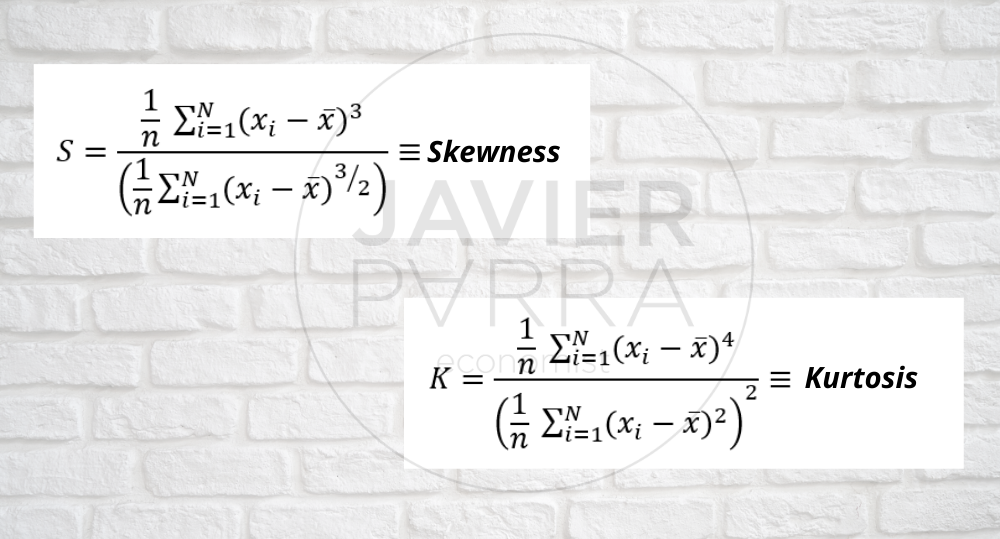
- Moments above the mean: Variance, standard deviation, skewness, kurtosis.
In the statistical and graphical analysis, specifically in the univariate analysis, we can observe two main elements to take into account:
- Kurtosis: The fourth central moment is whether the distribution is tall and thin or short and square, compared to the normal distribution of the same variance.
- Skewness: The measure of the skewness of the probability distribution of a real-valued random variable. The value of skewness can be positive or negative or even undefined. Qualitatively, a negative skewness value indicates that the tail of the left-hand side of the probability density function is longer than that of the right-hand side. Most of the values (possibly including the median) lie to the right of the mean.
Kurtosis
From the highest peak to the lowest peak:
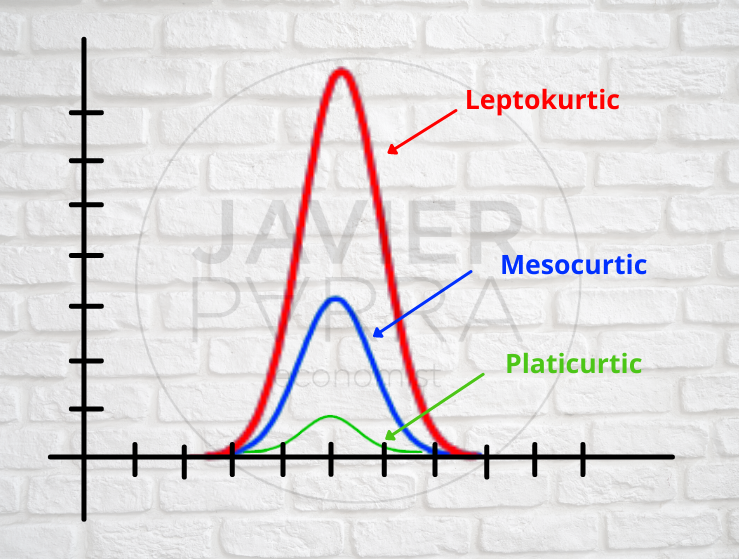
Kurtosis: Leptokurtic, Mesokurtic and Platykurtic:
- Leptokurtic: “Lepto” (meaning thin). In terms of shape, a leptokurtic distribution has a sharper peak around the mean.
- Mesocurtic: Semicircular distribution. Elevation in the cosine distribution. Uniform distribution.
- Platicurtic: “Plati” comes from tabla. It has a platicurtic distribution with a lower and broader peak around the mean in terms of shape.
Skewness

Types of asymmetry: negative and positive skewness
- Negative skewness: The height on the left is longer; the mass of the distribution is concentrated on the figure’s right. The distribution is said to be left (observations): 1,1001,1002,1003.
- Positive skewness: The high on the right is longer; the mass of the distribution is concentrated on the figure’s left. It has relatively few high values. The distribution is said to be right (observation) 1,2,3,1000.


