Before talking about economic modelling, it is necessary to understand what an econometric model is. Econometrics cannot explain perfectly the phenomena that occur in simple words. The best we can do is to use models, i.e. simplified representations of real phenomena.
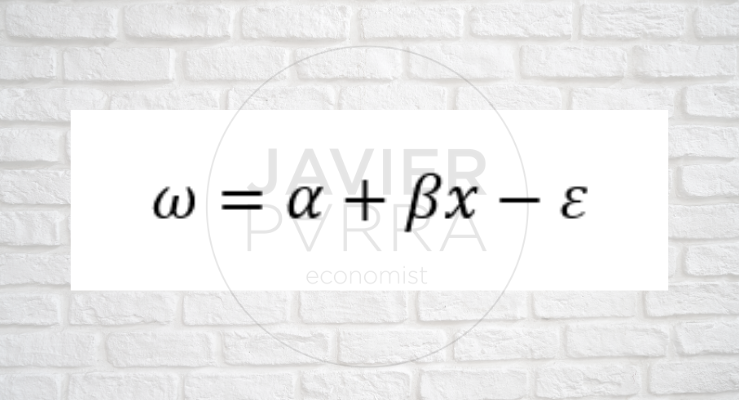
Where ω is the (logarithmic) wage, x is the number of years of schooling, Ɛ is the error term. β is how much your wage will increase by one more year of schooling. A macroeconomic example, in the Keynesian framework, aggregate consumption is a function of aggregate income (GDP). This translates into an econometric model that can be seen as follows:

So what is economic modelling? It is a set of descriptive equations (economic model); it is also a statement of the possible errors of the observations and a specification of the probability distribution of the disturbances.
Some examples:
- A city council wonders how much violent crime will be reduced if it spends an extra million euros to put uniformed police officers on the street.
- A candidate for the presidency of a country wonders how many additional voters in X state will support him if he spends $1 million more on advertising in that state.
- The owner of a local pizza franchise must decide how much advertising space to buy in the local newspaper and, therefore, must estimate the relationship between advertising and sales.
- The University of Salamanca must estimate how much the number of enrolments will decrease if tuition is increased by 100 euros per semester, and therefore whether its tuition revenue will increase or decrease.
Some elements we need to be clear about:
- Cross-sectional data: Observation of variables for N units in a period.
- Time-series: Tracking of the same individual for T periods.
- 1+2 panel data: Several individuals followed for T periods.
Let us look at economic modelling through examples:
Cross-sectional data
A cross-sectional dataset on wages and other individual characteristics:
| Remarks | Salary | Education | Experience | Female | Marriage |
|---|---|---|---|---|---|
| 1 | 3.10 | 11 | 2 | 1 | 0 |
| 2 | 3.24 | 12 | 22 | 1 | 1 |
| 3 | 3.00 | 11 | 2 | 0 | 6 |
| 4 | 6.00 | 5 | 44 | 0 | 1 |
| 5 | 5.30 | 12 | 7 | 0 | 1 |
| … | – | – | – | – | – |
| 525 | 11.56 | 16 | 5 | 0 | 1 |
| 526 | 3.50 | 14 | 5 | 1 | 0 |
- Wage: Euros per hour.
- Education: Years of education.
- Experience: Years of work.
- Female: Or other gender indicators.
- Marriage: Marital status.
Time series
Minimum wage, unemployed and related data in Puerto Rico
| Remarks | Year | Minimum average | Average coverage rate | Unemployment | GNP |
|---|---|---|---|---|---|
| 1 | 1950 | 0.20 | 20.1 | 15.4 | 878.7 |
| 2 | 1951 | 0.21 | 20.7 | 16.0 | 925.0 |
| 3 | 1952 | 0.22 | 22.6 | 14.8 | 1615.9 |
| … | … | … | … | … | … |
| 37 | 1956 | 3.35 | 58.1 | 18.9 | 4281.6 |
| 38 | 1957 | 3.36 | 58.2 | 16.8 | 4496.7 |
- Average minimum: Average minimum wage per year.
- Average coverage rate: Percentage of jobs covered by the minimum wage.
- Unemployment: Unemployment rate.
- GNP: Gross national product.
Panel data
Two-year panel data set on crime statistics in the city
| Remarks | City | Year | Deaths | Population | Unemployment | Police |
|---|---|---|---|---|---|---|
| 1 | 1 | 1986 | 5 | 350000 | 8.7 | 440 |
| 2 | 1 | 1990 | 8 | 359200 | 7.2 | 471 |
| 3 | 2 | 1986 | 2 | 64300 | 5.4 | 75 |
| 4 | 2 | 1990 | 3 | 68100 | 5.5 | 75 |
| … | … | … | … | … | … | … |
| 297 | 149 | 1986 | 10 | 260700 | 9.6 | 286 |
| 298 | 149 | 1990 | 6 | 245000 | 9.8 | 334 |
| 299 | 150 | 1986 | 25 | 543000 | 4.3 | 520 |
| 300 | 150 | 1990 | 52 | 546200 | 5.2 | 495 |
- Deaths: Number of deaths.
- Population
- Unemployment: Unemployment rate.
- Police


